Contact Us
Wednesday 19th April 2023
Our Permitting & GIS Manager Brian Perratt, recently had an article published in PES Wind magazine. You can read the article as printed in the publication here, or carry on to read in full below.
Submarine telecoms cables have an average of 210 faults per year on the global infrastructure, the vast majority of which are caused by external aggression such as fishing and anchoring.
Many of the increasing network of power interconnector, array and export cables follow similar routes or are in similar areas as the shallower water telecoms cables. We can therefore be reasonably confident that the same threats that cause outages on telecoms cables have the potential to have the same impact on power cables. With cable damage accounting for as much as 80% of insurance claims for offshore wind farms and individual cases known to have caused losses of £10 million when lost output and repair costs are combined, it’s an issue that can’t be overlooked.
Most offshore renewables export cables and power interconnector cables have been installed in the last 15 years or so, conversely fibre optic telecoms cables have been in use since 1986. This, coupled with the relatively low number of power cables in comparison to telecoms, means that we have a lot less data and insights around their fault rates, causes and predictions since there are far fewer power cable faults over a smaller area to analyse. In the waters around the North Sea, English Channel and Irish Sea for example, there have been over 900 telecoms cable faults in the last 35 years but only approximately 70 power cable faults recorded over the same area since the year 2000.
The causes of cable outages on both telecoms and power cables are similar. However, the numbers attributed to each cause are substantially different.
According to a recent study carried out by ORE Catapult only 8% of power cable outages were as a result of third party external damage. All other outages occurred as a result of the installation process or from a manufacturing issue. Conversely, telecoms cable outages are predominantly caused by third party damage with only 5% being attributed to installation or manufacturing issues.
The number of manufacturing and installation outages on power cables are likely to reduce in future due to improved installation methodologies and cable design. However, as more kilometres of power cable is installed the number of third party outages is likely to increase. Cable awareness campaigns and AIS vessel monitoring may help to negate this, however, it would be naive to think that external damage will ever be completely eradicated. Therefore, any measures we can take to help ensure cable integrity should be welcomed. This is where the analysis of historical telecoms outages can help.
Historical data can provide a detailed understanding of what areas are more prone to damage from third party aggression. This can be further broken down to detail what the causes of faults have been and are therefore likely to be in the future.
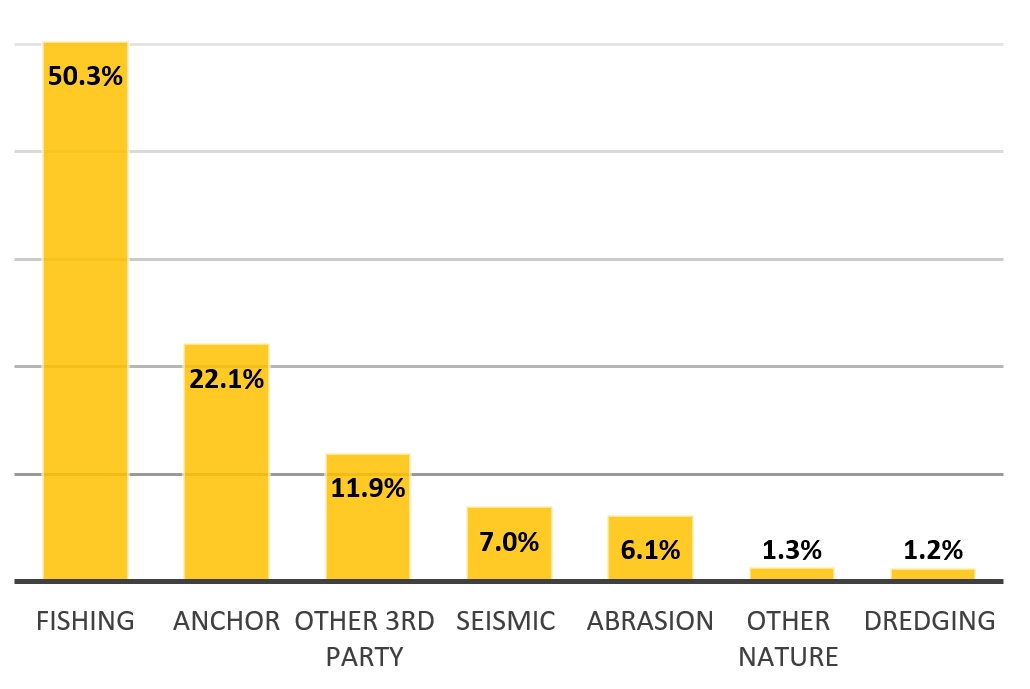
Third party damage is predominantly caused by fishing and anchoring for both telecoms and power cables. Figure 1 shows a breakdown of the causes of faults worldwide on the telecoms cable network from 1986 to present day
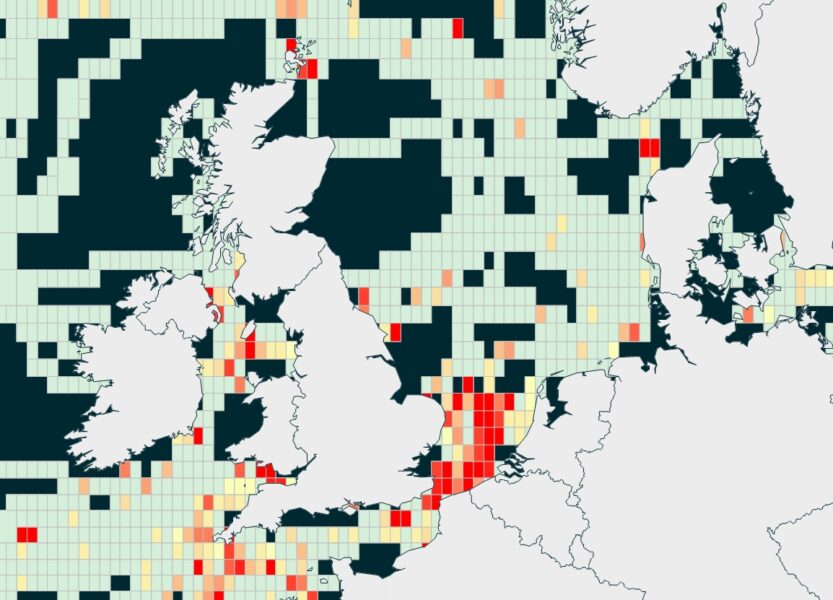
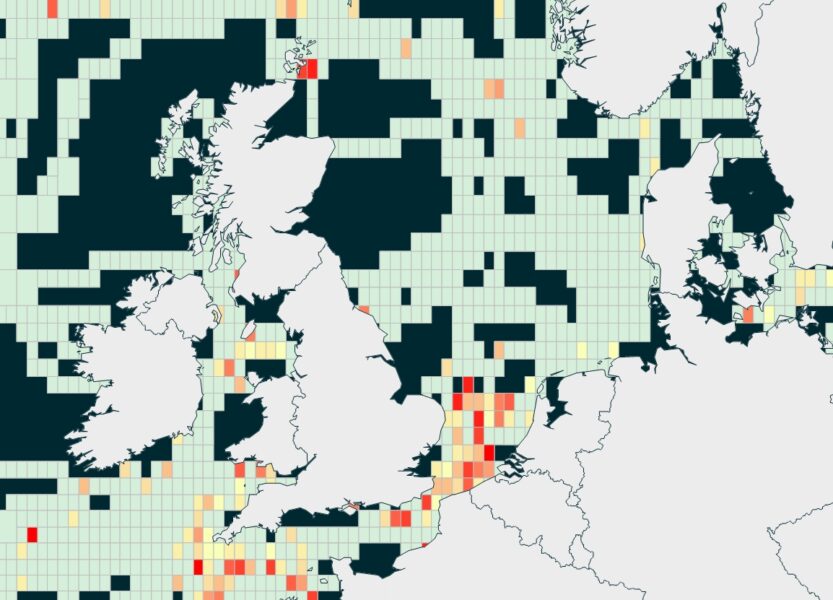
By analysing the what, where, when and why for all of these faults a meaningful fault rate heat map and prediction model has been created. Areas of high fault rates and their causes can be identified, and the fault rate prediction model provides an educated calculation as to the likely number of faults for new cable systems. This analysis is for telecoms cables, however we can start to apply the same principles to power cables by using this information along with a more targeted in depth study of the expected burial depth of the power cable versus the burial depths of the telecoms cables.
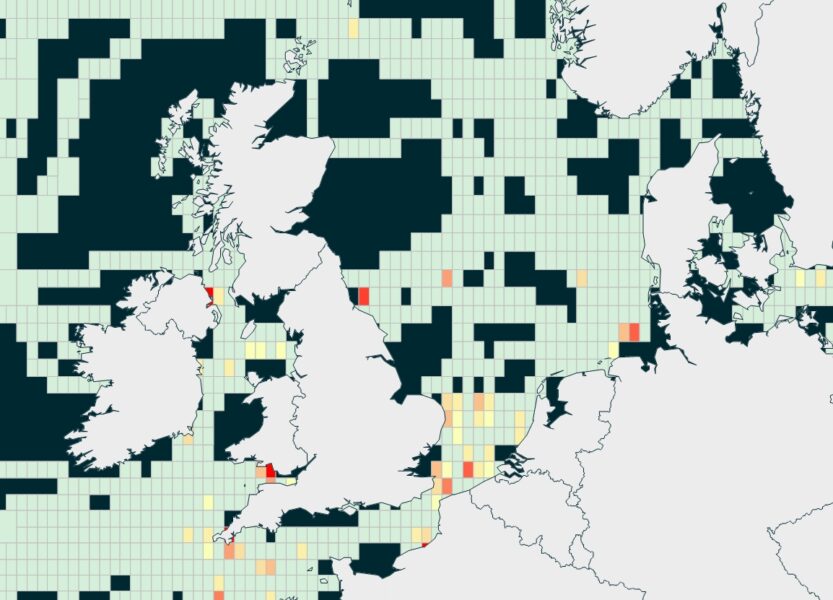
The Fault rate heat maps use a grid cell structure to ensure cable anonymity. By cross referencing the cable lengths and number of faults (telecoms) that have occurred in each grid cell an expected number of faults per kilometre of cable per year can be calculated. Figure 2 shows an example fault map for all fault causes. The green areas have experienced no faults, yellow low fault rate through to red, high fault rate. Figure 3 shows the same area for fishing faults and Figure 4 for faults caused by anchors.
By using the heat map data layers a fault rate prediction report can be created. This allows for the prediction of how many, where and why faults are likely to occur on newly installed or planned cables, all based on actual historical fault occurrences.
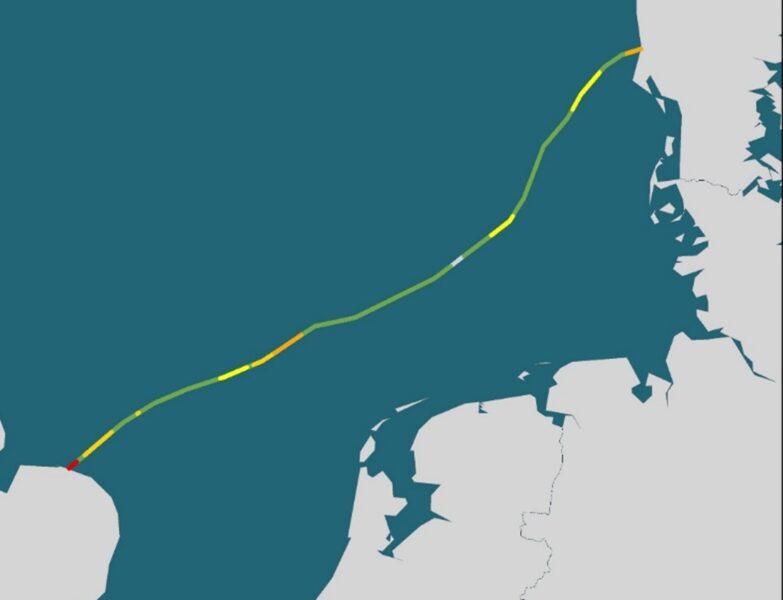
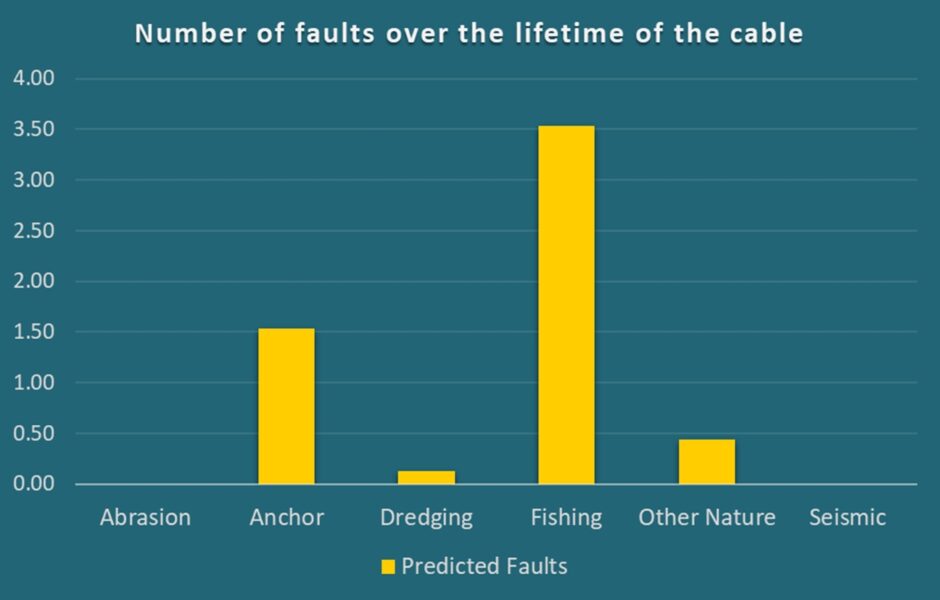
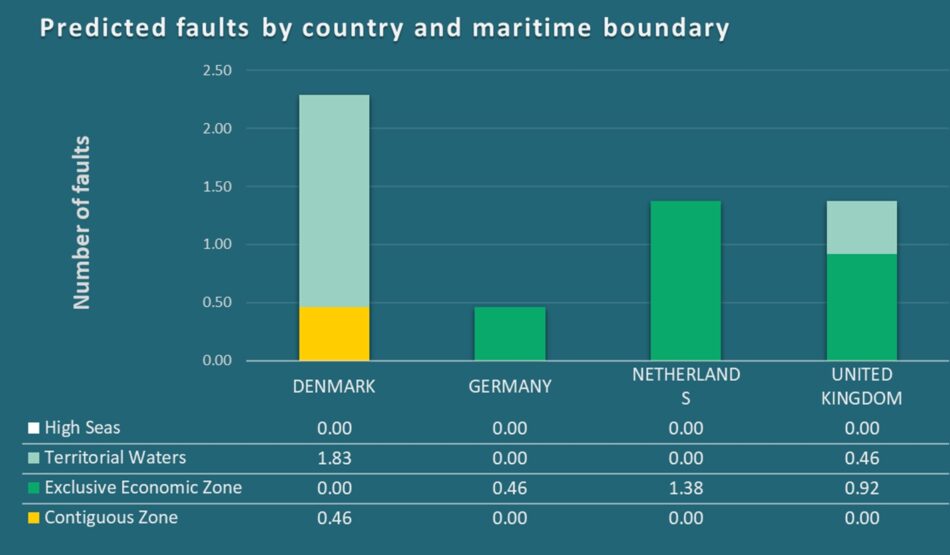
Figure 5 is an example of a fault prediction map for a fictional cable system crossing the North Sea. Again, green areas are no expected faults, yellow low, and red high fault rates. The report also gives a breakdown of the likely causes of faults along with which country’s maritime waters they will be in, figures 6 and 7
As can be seen, by reviewing the historical telecoms data we can get a good understanding of the number and causes of faults that may affect power cables and as a result modify the approach to their planning, installation and maintenance to reflect that intelligence. Be it altering the routing to avoid fault hotspots, utilising different cable protection techniques or considering installation methodologies in more detail – addressing the factors that are potentially fixable and more within our control.
The cable fault heat maps and prediction model for telecoms cable provides an in depth understanding of the likely causes and number of faults. If we have data covering areas where power cables are being installed then we can utilise the same data to give an understanding of the external threats likely to cause problems to power cables. However, there are differences that need to be taken into account that prevent a direct crossover to power cable fault analysis.
Power cables often have slightly deeper burial and installation techniques can also differ. Power cables tend to be trenched whereas telecoms are more often ploughed into the seabed. Pre-sweeping of sand waves where the top of the sand wave is removed prior to installation of the cable, is more likely to occur for power cables and is very rare for telecoms cables.
Historically telecoms cables have had a target burial depth of 1m. In some locations this is increased to 1.5 or 2m where there is a greater risk of cable damage. This is a target burial depth and the actual depth achieved is often slightly less.
The target burial depth for power cables is similar, burial depths achieved are often slightly deeper than telecoms though and are often dictated by regulatory and environmental conditions. 2-3 m burial depths for some areas are often dictated by legislation.
More work is being done to understand the differences in fault rates versus burial depth which will give us a better understanding of the impact of deeper burial on the number of outages caused by external factors.
Power cable damage resulting in outages has a huge economic impact. Some parts of the world are reliant on a single source of power coming into their country or location and with rerouting not an easy option, a subsea cable fault can leave thousands of homes and businesses literally in the dark. Other cables transporting energy from its source – perhaps at an offshore wind farm – back into the grid are critical, not only for the consumers of that energy, but also for the businesses running those wind farms whose losses from cable downtime can be in the millions of dollars.
Repair campaigns are not only costly, but can often take months to organise thanks to the demand for and availability of suitable vessels, personnel and other resources, as well as ensuring the planning, permits and consents are in place for any offshore operations. This is particularly important to consider in the shallower, congested areas of the seabed such as in and around offshore wind farms, where there are multiple parties using the same real estate.
Because of this, preventing faults from occurring in the first place will always be a better strategy than simply reacting to the damage as and when it happens.
We have a robust set of data for telecoms cables that allow us to make an educated assessment of the likely number of faults that a cable will experience over its lifetime. The large amount of historical data coupled with the extensive cable footprint has facilitated this. The same level of data is not available for power cables. With the similarities in location of power and telecoms cables and similar burial depths it is reasonable to assume that the external factors causing telecoms cable outages have the very real potential to cause power cable outages also.
There are obvious differences between the two cable types, however, by doing further analysis on these differences we can be more focused on the threats to power cables. Understanding these threats will allow engineers to plan for them, either through route changes, deeper burial and additional cable protection such as rock placement and mattressing. Cable awareness campaigns can be put in place to target other seabed users and ensure they are fully aware of the cable location, prevention being better than the cure.
More work is being done by the team at OceanIQ to fully understand how best to translate the data from the telecoms industry to the power cable industry. The aim is to create a meaningful set of analytical tools that will provide another weapon in our armoury to help protect the critical power cable infrastructure that we all rely on in our daily lives, making the ‘unknowns’ a little more known, and enabling cable owners to make smart, informed decisions about their assets for their long-term security and integrity.

Brian is our Permitting & GIS Manager, and is responsible for overseeing all aspects of Permitting, Charting, SEA Data records management and GIS, Brian manages a proactive and dedicated team that supports projects across multiple markets. With over 25 years of experience in the industry, Brian has gained a wealth of knowledge working on numerous marine projects around the world.
Brian recently developed OceanIQ’s ‘Cable Fault Heat Map’ and ‘Cable Fault Prediction Report’ tools, utilising data from over 6,000 historical cable repairs enabling customers to understand the potential pitfalls that may impact their projects.